Turn Data into Decisions with Powerful Excel & Power BI Dashboards
🔍 What is Business Intelligence Reporting?
Business Intelligence (BI) reporting transforms raw data into actionable insights, helping organizations: ✔ Track performance in real time ✔ Identify trends and opportunities ✔ Make faster, data-driven decisions ✔ Automate reporting for leadership and teams
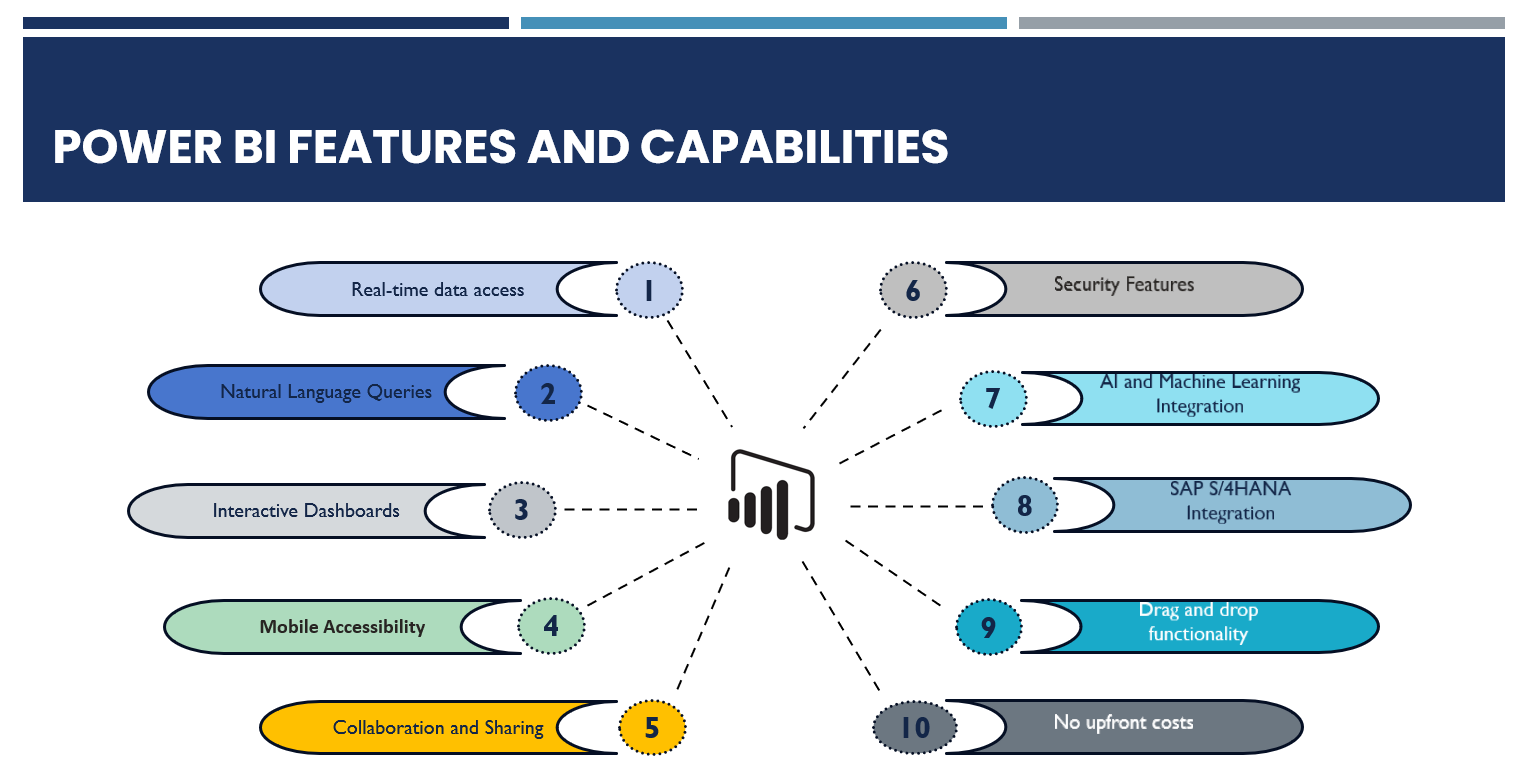
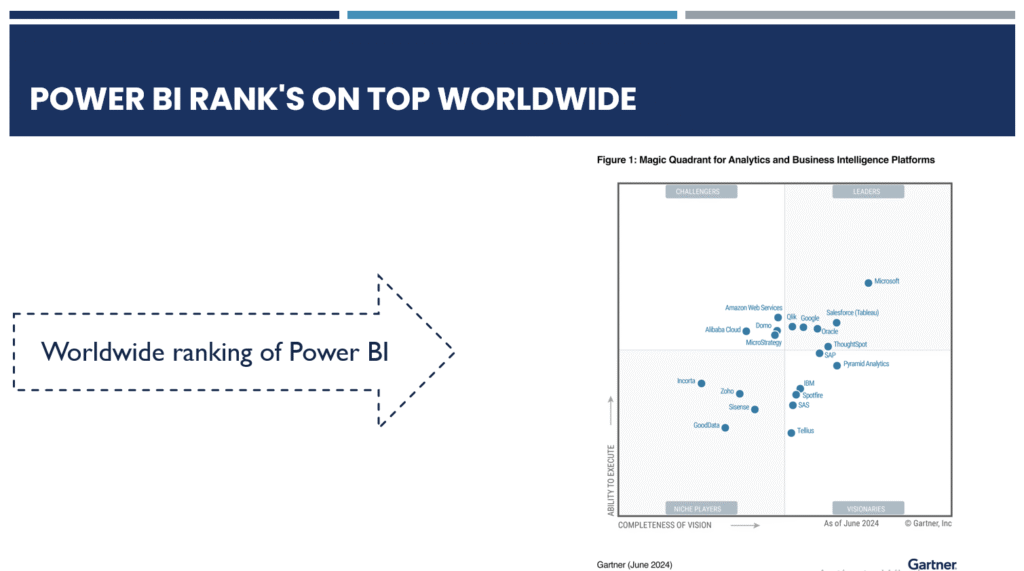
🔍Why choose Power BI as Companion?
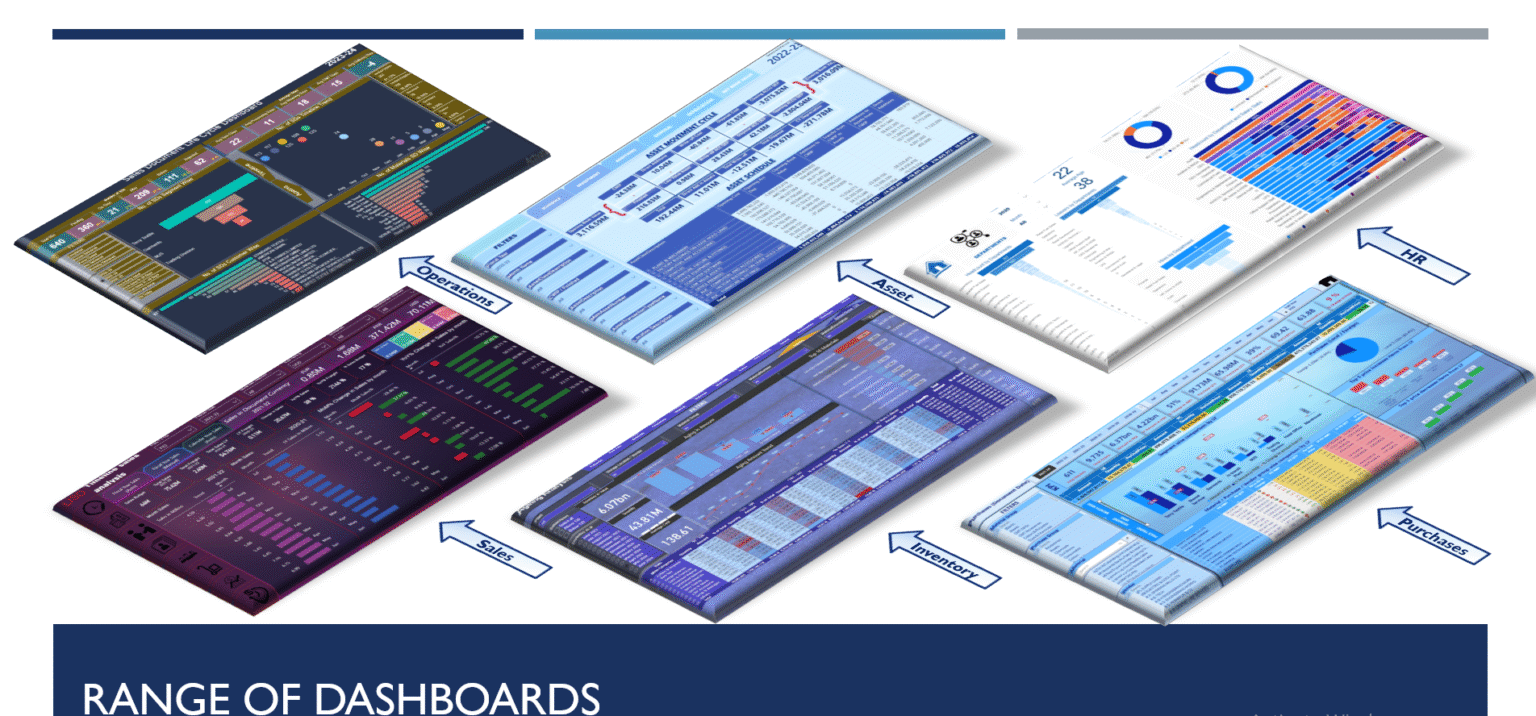
🚀 Our BI Reporting Services
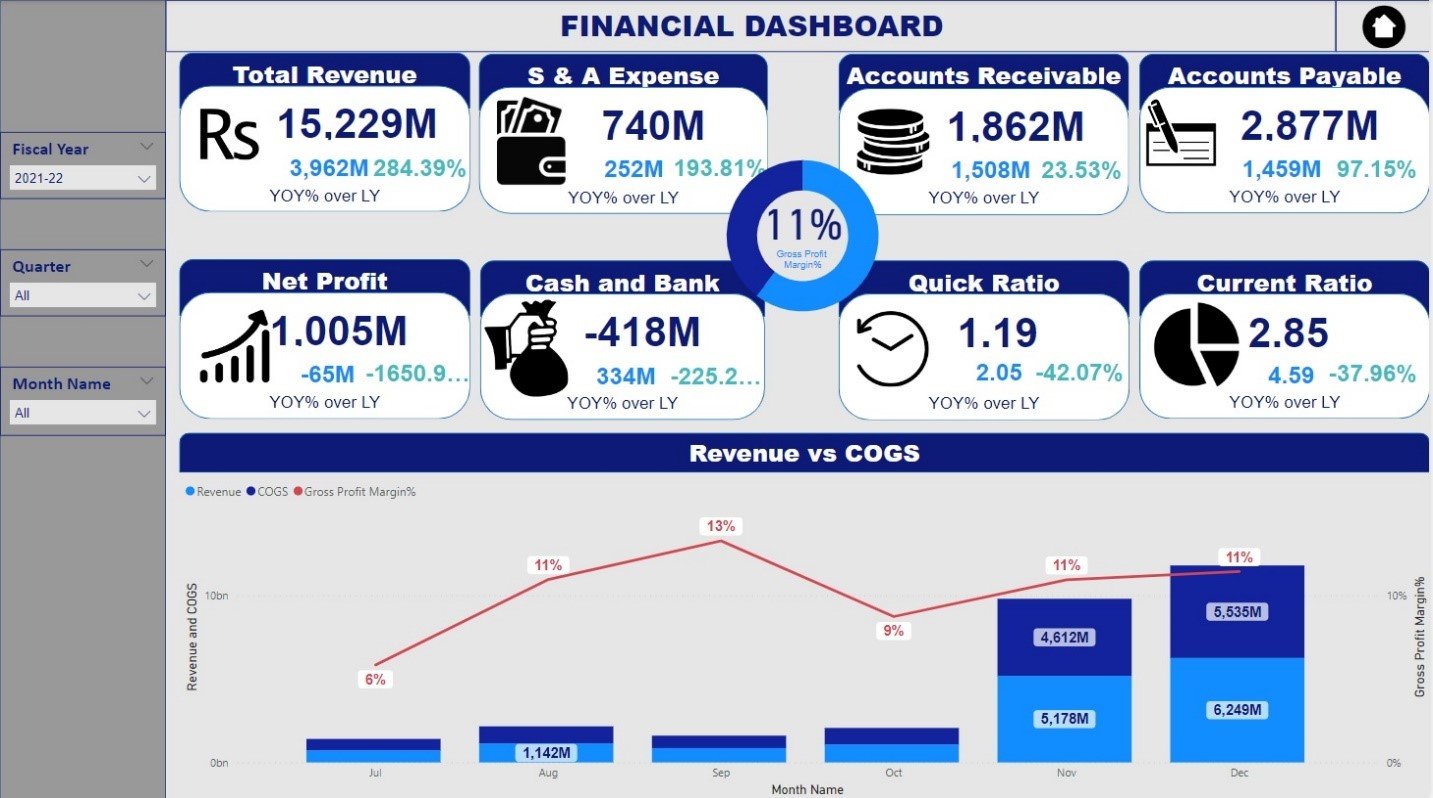
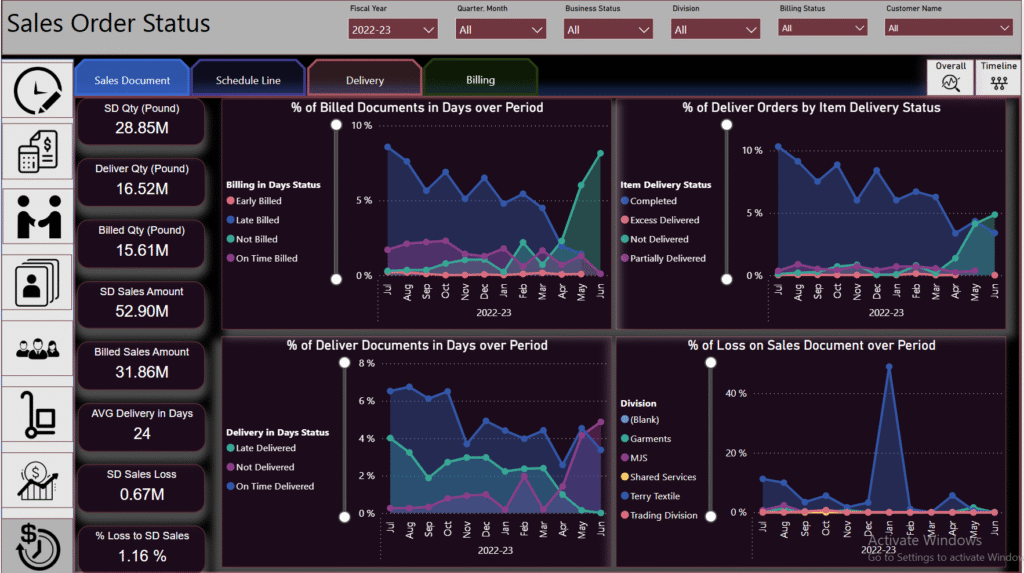
Financial Performance Dashboards
✅ Real-time P&L tracking – Connect QuickBooks, Xero, or ERP systems ✅ Cash flow forecasting – Predict future liquidity with AI-driven models ✅ Cost variance alerts – Get notified when expenses exceed budgets
📌 *Example: A manufacturing firm reduced month-end closing from 10 days to 2 hours with automated financial dashboards.
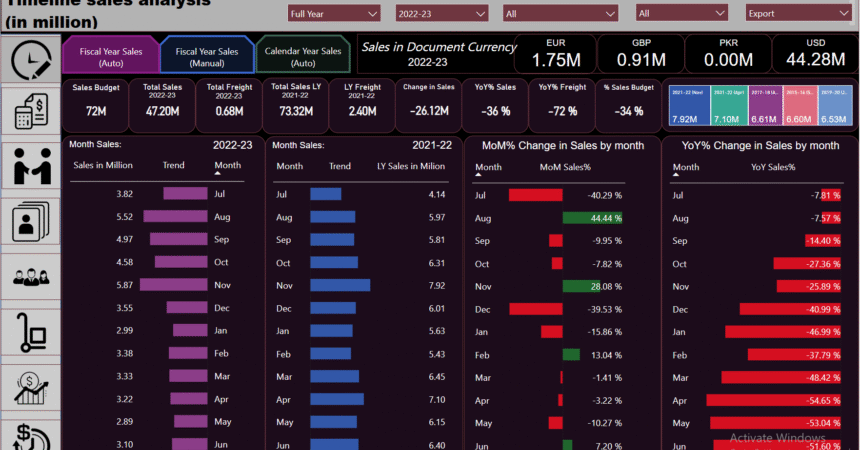
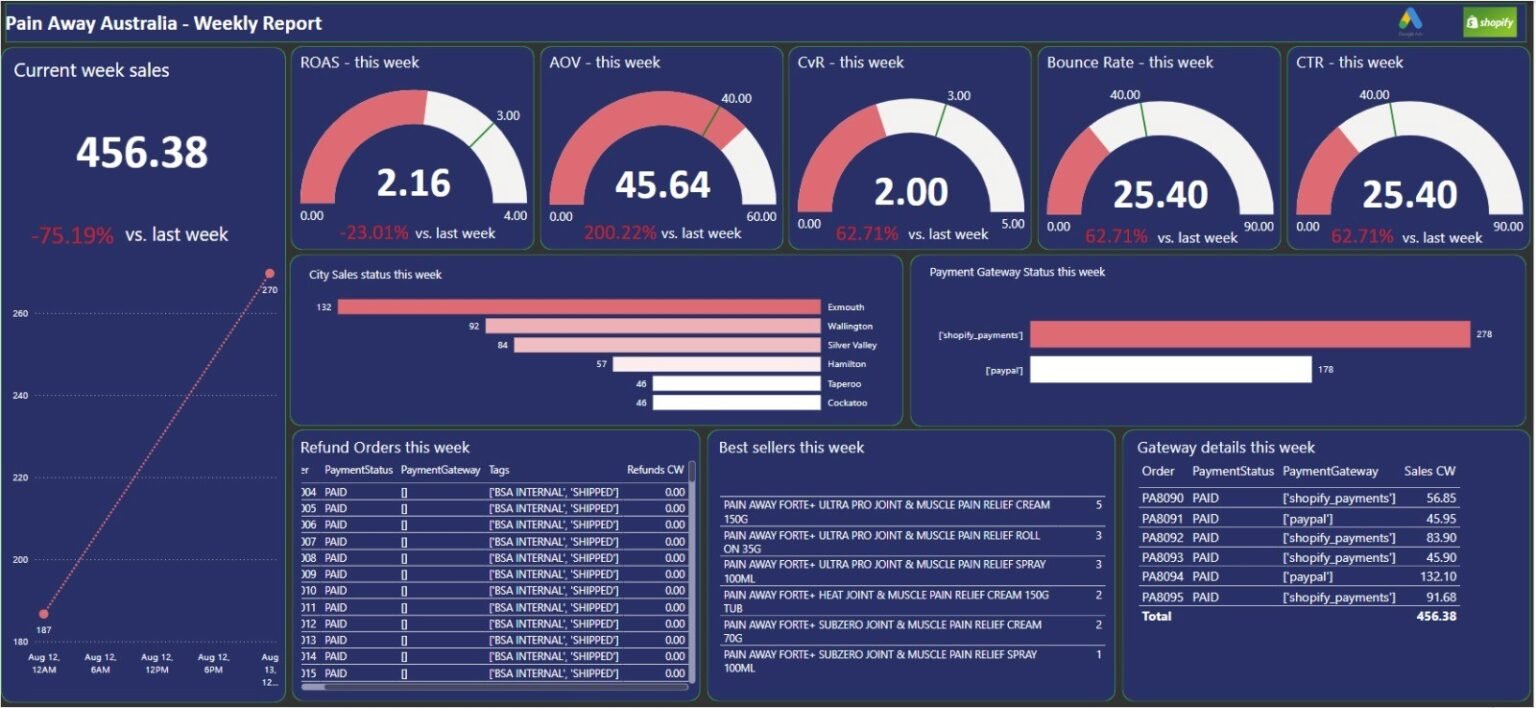
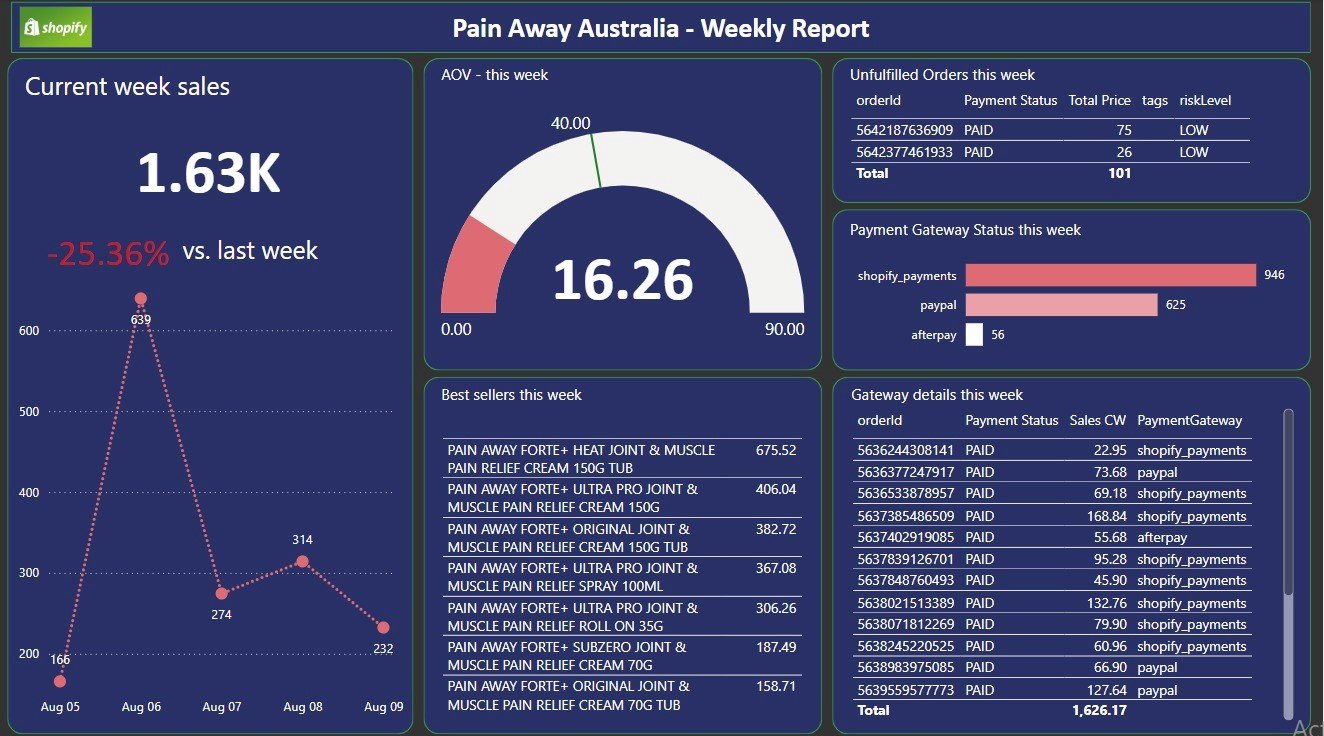
Sales & Revenue Analytics
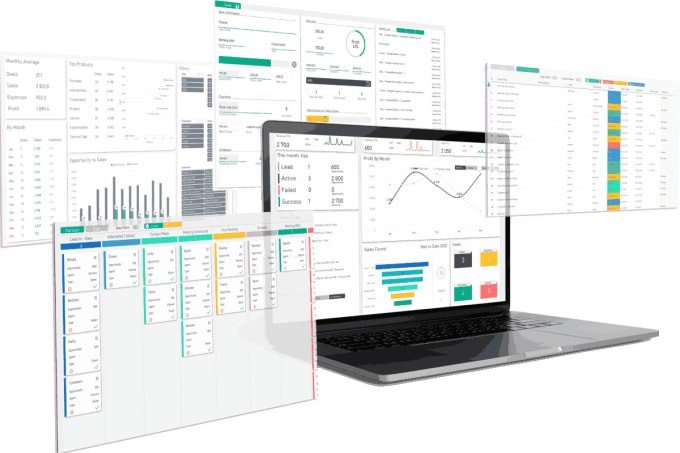
(Image: Sales dashboard with regional performance, top customers, and pipeline tracking.) ✅ Live CRM integrations – Salesforce, HubSpot, or Bullhorn ✅ Revenue trend analysis – Compare YTD, QoQ, and MoM growth ✅ Automated sales commission calculations – Pull data from CRM and apply rules 📌 *Example: A retail chain improved sales targeting by 27% using geographic sales heatmaps (ESRI + Power BI).
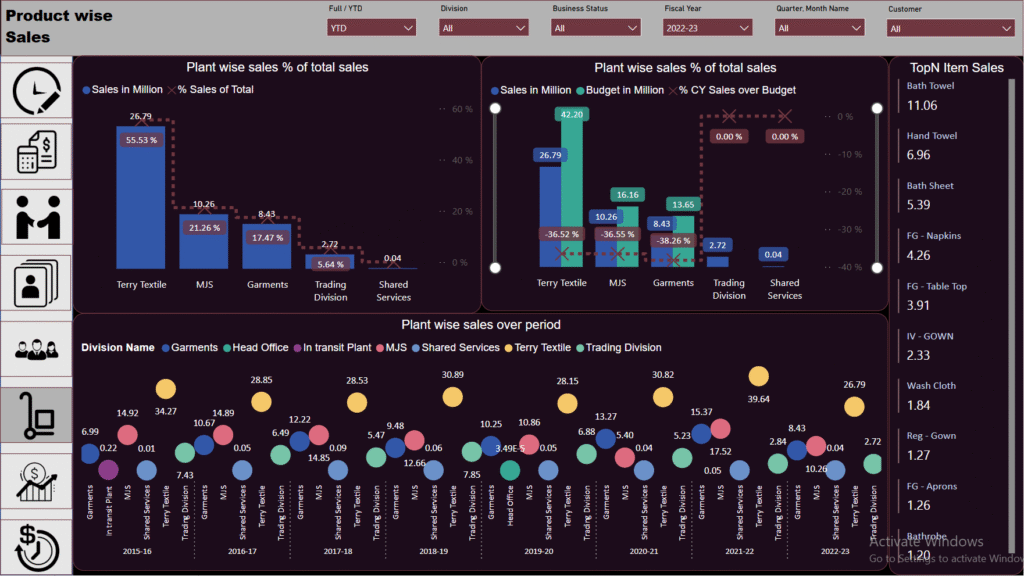
Operational Efficiency Reports
✅ Shopify/WooCommerce inventory automation – Low-stock alerts & reorder triggers ✅ HR & workforce analytics – Track productivity, turnover, and labor costs ✅ Supply chain monitoring – Track supplier performance and lead times
📌 *Example: A logistics company reduced delivery delays by 19% using real-time fleet tracking dashboards.
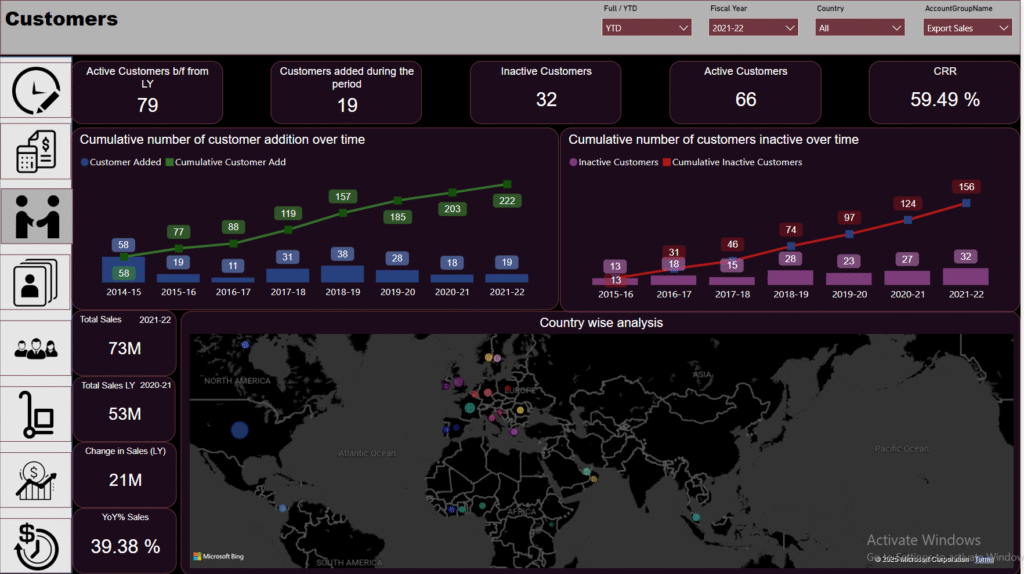
Marketing & Customer Insights
✅ Automated campaign reporting – Connect Google Ads, Meta, LinkedIn ✅ Customer segmentation – Identify high-value buyers and churn risks ✅ Lead-to-revenue tracking – Measure marketing’s impact on sales
📌 Example: An eCommerce brand boosted ad ROI by 33% by automating daily performance reports.
⚙️ How Our BI Reporting Works
Connect – We link your data sources (QuickBooks, Shopify, APIs, etc.).
Model – Clean, transform, and structure data for analysis.
Visualize – Build interactive dashboards with drill-down capabilities.
Automate – Schedule refreshes and email reports to stakeholders.
💡 Why Choose Our BI Solutions?
✔ No manual reporting – Dashboards update automatically ✔ Mobile-friendly – Access insights on any device ✔ Custom alerts – Proactive notifications for anomalies ✔ Scalable – Start small, expand as needed 📌 “Your Power BI dashboards gave our executives instant visibility into operations—no more waiting for IT reports!”