Service Advance Excel Reporting
📊 Advanced Excel Reporting Services
Transform Complex Data into Actionable Business Insights
🚀 Why Choose Advanced Excel Reporting?
Excel remains the #1 tool for business analytics—when used right. We build dynamic, error-proof reports that:
✔ Automate repetitive tasks (saving 10+ hours/week)
✔ Visualize data clearly for all stakeholders
✔ Connect to databases/APIs for real-time updates
✔ Scale from basic summaries to enterprise-level models


💡 Our Advanced Excel Reporting Services
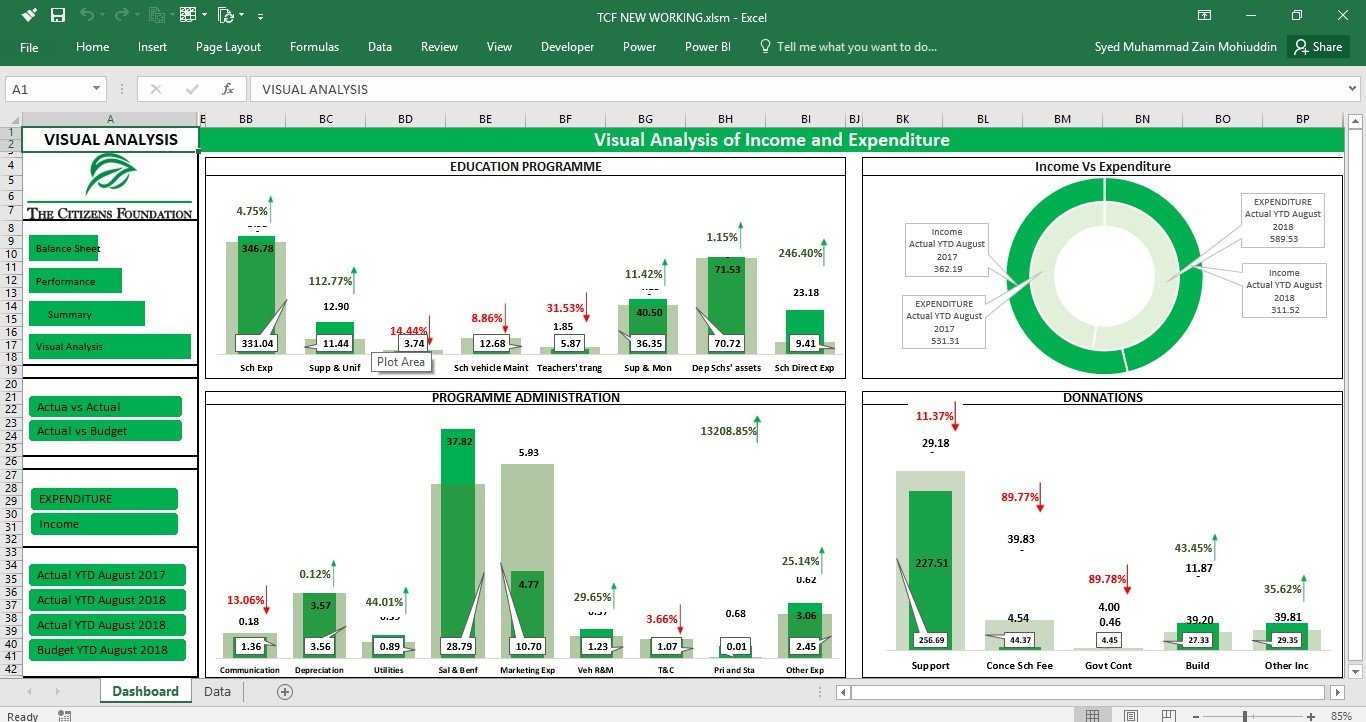
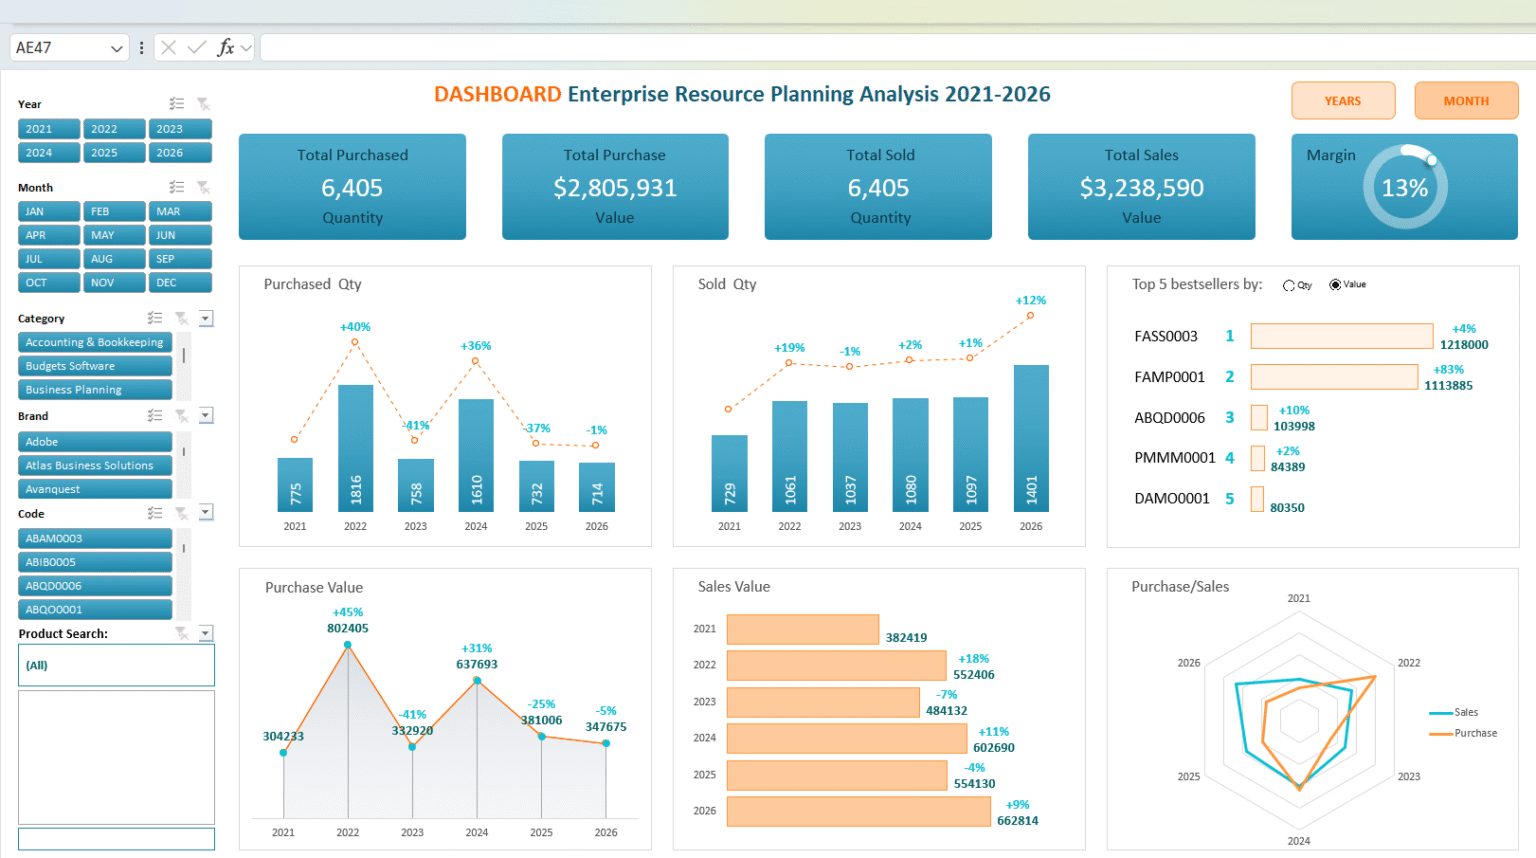
Automated Financial Reports
✅ Monthly close automation – Pull data from QuickBooks/Xero
✅ Cash flow forecasts – Scenario modeling with What-If Analysis
✅ Budget vs. Actuals – Conditional formatting highlights variances
📌 *Example: A nonprofit reduced grant reporting time by 75% with auto-generated Excel templates.
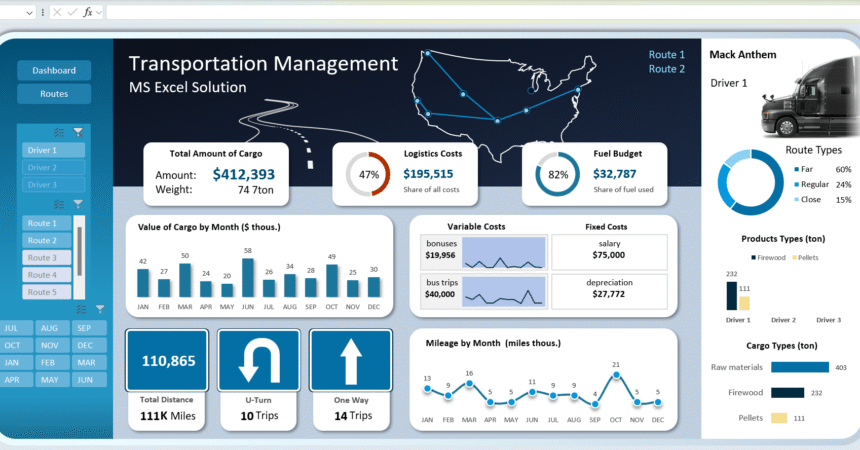
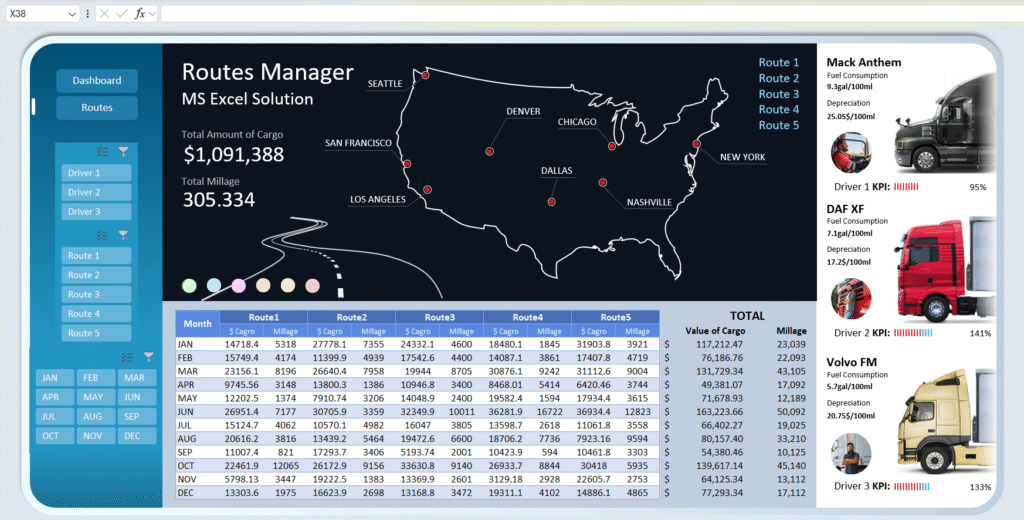
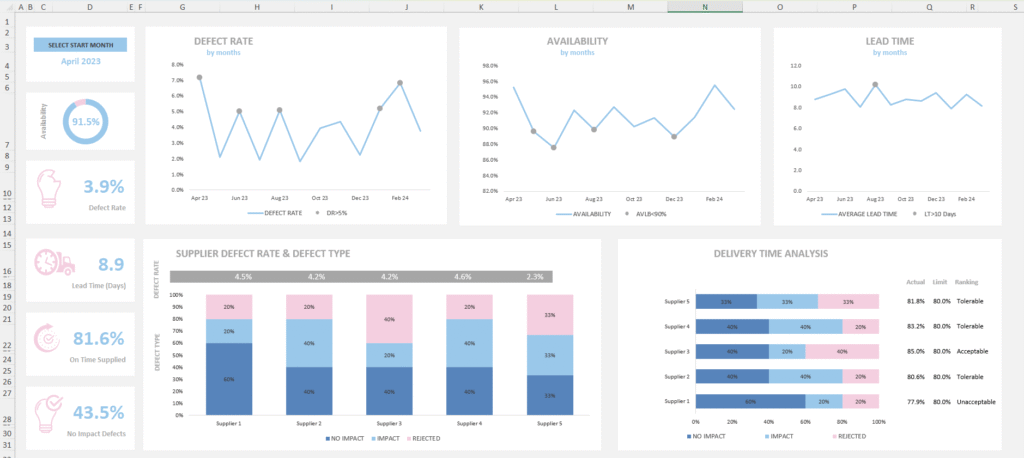
Interactive Sales & Inventory Trackers
(Image: Excel dashboard with slicers for region/product filters.)
✅ CRM integration – Salesforce/HubSpot data in Excel
✅ Low-stock alerts – Formulas + conditional formatting
✅ Commission calculators – Linked to sales databases
📌 *Example: A retail chain tracks 500+ SKUs using Excel + Power Query automation.
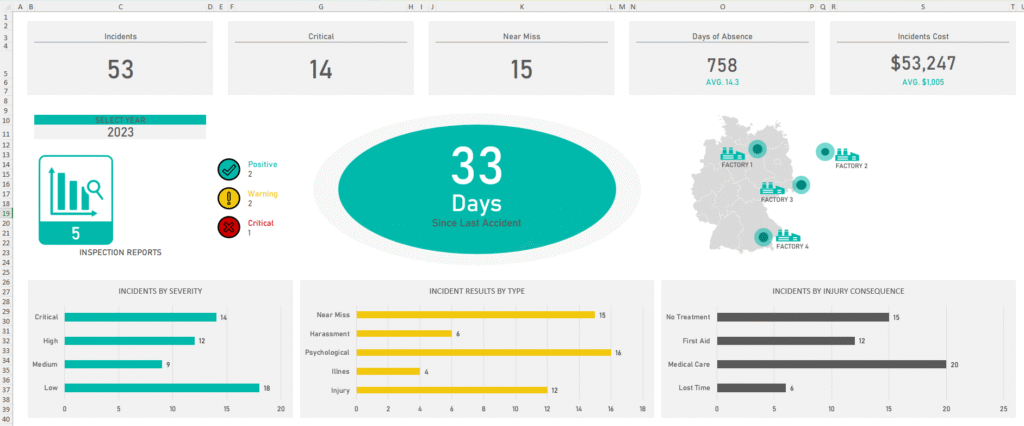
HR & Payroll Automation
(Image: Excel timesheet with auto-calculated OT and taxes.)
✅ Attendance templates – Integrate with clock-in systems
✅ Payroll reconciliation – Match hours to bank transactions
✅ Turnover analysis – PivotTables + trend charts
📌 Example: An HR team processes payroll for 200 employees in 1 hour vs. 1 day.
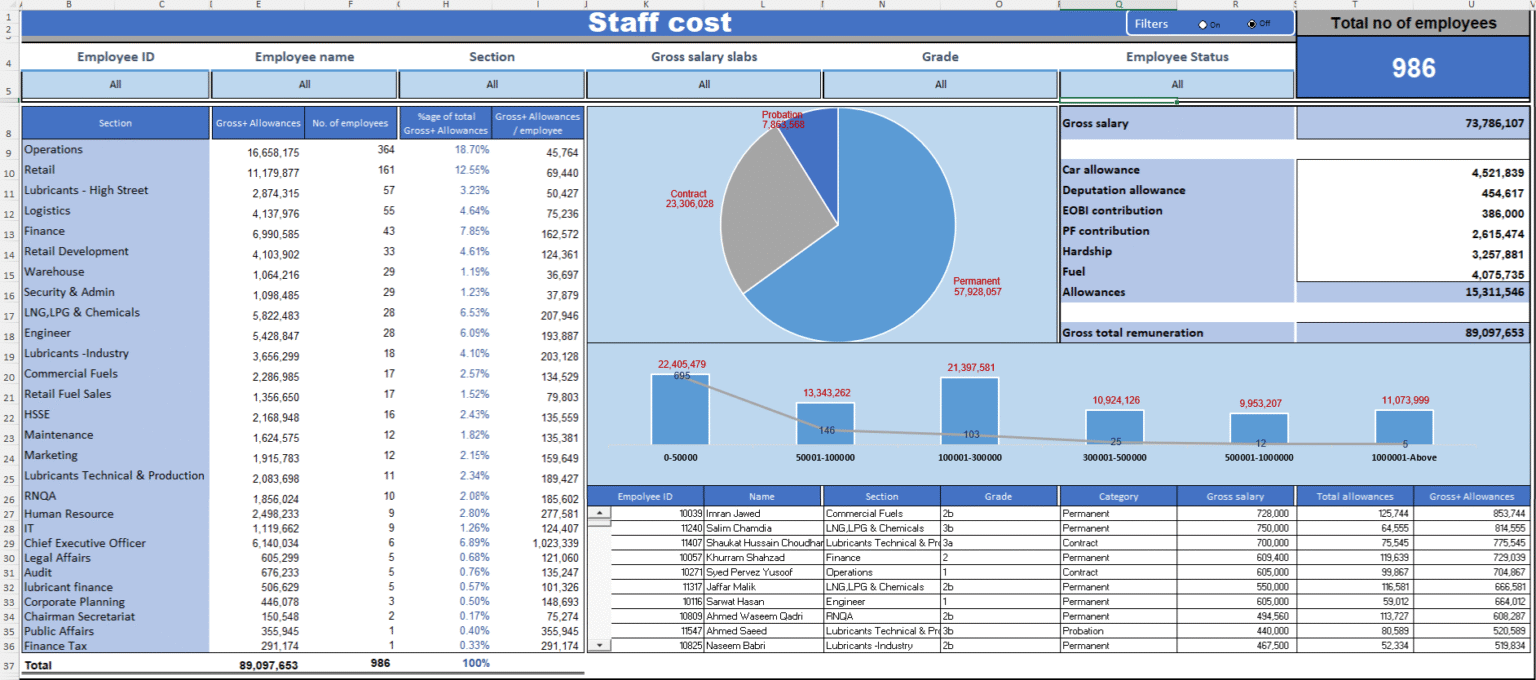
Custom Data Models & Analysis
(Image: Complex Excel model with dependent drop-downs and scenarios.)
✅ What-If Analysis – Test pricing/volume changes
✅ Monte Carlo simulations – Risk assessment modeling
✅ Industry-specific templates – Healthcare, logistics, etc.
📌 Example: A manufacturer models supply chain disruptions using Excel simulations.
💎 Key Advanced Features We Use
Power Query | Clean/merge data from multiple sources |
Power Pivot | Handle millions of rows efficiently |
VBA Macros | Automate repetitive tasks |
Dynamic Arrays | Build self-updating formulas |
XLOOKUP | Replace error-prone VLOOKUPs |
⚙️ How We Build Advanced Excel Reports
*(Infographic: 5-Step Process with icons.)*
- Consultation – Identify pain points and data sources
- Design – Wireframe dashboards/report layouts
- Develop – Build formulas, Power Query, VBA macros
- Test – Validate accuracy with your team
- Train – Handover with documentation